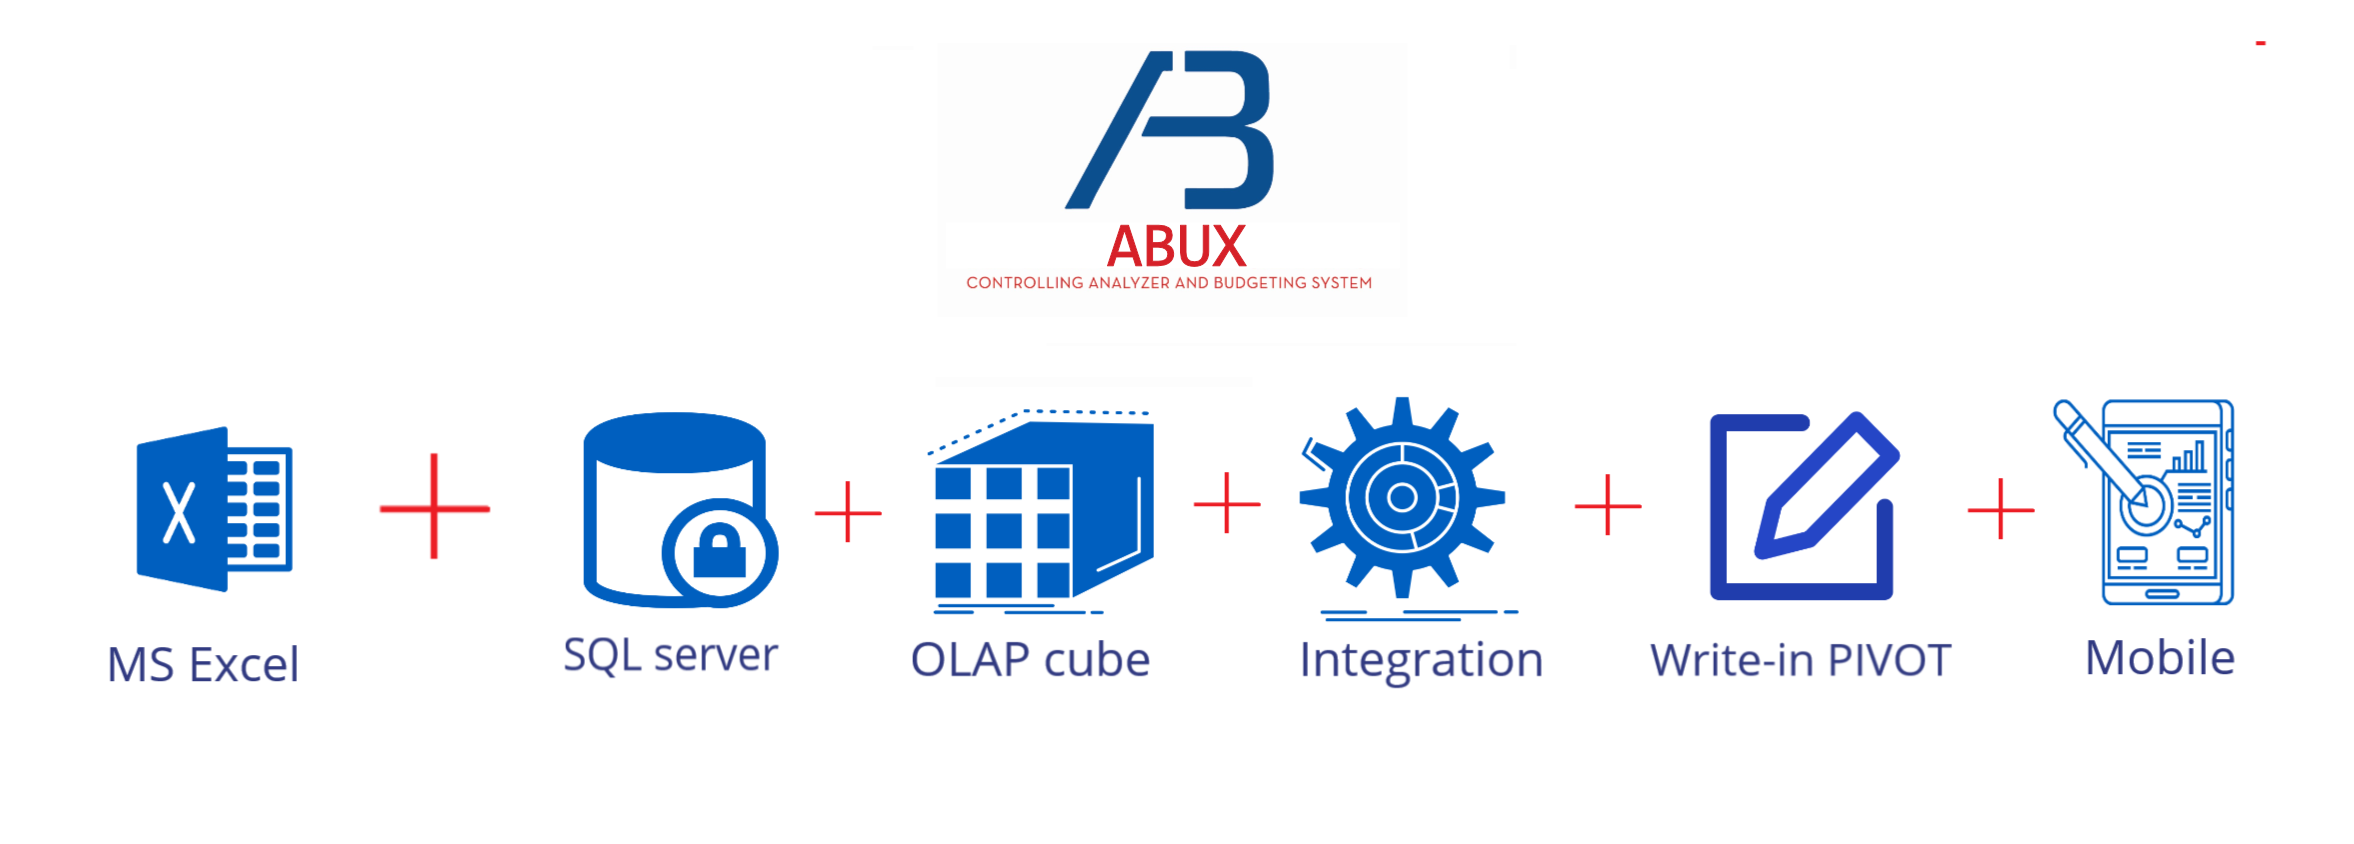
Excel is admirable, but as we handle more information, faster reactions, and ad-hoc analysis are expected. Excel is not always capable of serving this environment. It is a major flaw, but throwing our Excel knowledge to the dogs is not the solution we offer. ABUX can eliminate the technical barriers of Excel and resolve many shortcomings and difficulties in planning and reporting processes.

In addition to eliminating repetitive processes, fragile systems of cell hyperlinks, and a huge amount of manual work, ABUX offers other potential benefits that we’ll mention here:
Planning process with Top-Down and/or with Bottom-up
Excel is not designed to allocate data and then collect new versions. There is lack of process control when data is copied and shared multiple times.

You know exactly the workflow of planning in Excel. Companies mostly use top-down approach for target setting and bottom-up data collection. In most cases, employees receive an empty Excel sheet, followed by several meetings to approve or reject these budgets.

ABUX is capable of handling multiple scenarios, solving the challenges posed by geographical distance and the fragility of input data with its single source of truth and unified platform. Direct data input into Pivot tables and automated steps further contribute to a seamless planning process.
Permissions and security
It is difficult to protect data in Excel i.e. payroll and forecasts.

Excel sheets often contain the most confidential and sensitive information of a company, such as forecasts and market data. Unfortunately, these data are typically shared through the email system among users.

Access-controll based on: role, scope of the plan, inner culture or any other aspects. Approval/rejection and data locks are also a built-in function of ABUX.
Data validation - Drilling till the source data
Data has to be manually pulled into Excel. With hundreds of changes and isolated platforms, data validation is not possible.

Is this question familiar to you on any steering committee: What kind of costs are exactly allocated into that cost group? What factuals alter planned data?

ABUX offers a single source of truth, automatically validating data: each user accesses the same pool of data, accepted by everyone. Data drilling is a fundamental feature of ABUX. With just one click, you can view the details of a cumulative line down to the source data (e.g., invoices in your bookkeeping system).
Altering and loading data directly through Pivot table
The Pivot table is used to arrange and rearrange data.


Pivot table is a platform for data input: load, write-in, alter figures in Pivot. ABUX handles all the background works – new data appears simultaneously in other parts of your plan. (i.e.: When you increase sales volume, the cost allocation is automatically recalculated based on the larger volume.)
Switch between facts and plans
It is not easy (or even impossible) to quickly and effectively do history comparisons and variance analysis.

To switch between multiple platforms and working in personal budgeting Excel sheet can easily lead to errors. Creating a separated Excel sheet especially for comparison? Working on three or four monitors at the same time?

Mitigate risk! ABUX provides automatic loading processes from any system. Current and historical data from the source system are kept up to date in a centralized solution. This can also resolve the difficulties of version changes in ERP systems, which usually involve storing different periods in different databases.
Rolling forecast
Possible, but functions are so limited that it’s not worth starting a rolling forecast in Excel.

Creating a separate Excel sheet for rolling forecasts is a common practice at companies. Problems occur when we want to change the settings in the meantime: the level of detail, identifying the object and the value drivers, reconsidering time frames, etc.

In ABUX, you can:
- – create connections between real-time market trends and your strategic goals,
- – increase accuracy with automatic data transmission from a “single source of truth”,
- – build planning frameworks based on drivers and projects: visualize financial and operational figures for the future in each quarter or month, etc.
Manageable size of reports
Huge spreadsheets circulate within the organization. Data loss, damage to cell hyperlinks, and slipping of formulas are common occurrences.

- Reports are shared in Excel spreadsheets via emails. Have you ever considered how much extra storage space your company needs for storing data multiple times?

No more duplication or missing data points. This function is just a result of common database management. Excel sheets do not function as databases; this role is fulfilled by the SQL server behind ABUX. Excel serves solely as an input-output interface.
Customize reports promptly – Do it your way
Dynamic reporting is very limited. Quick validation of structural changes in reports don’t work. Is Power Point really the obvious tool for creating management report?

What if the audience could organize data based on their own interests? Controllers would be solely responsible for the professional aspects of the reports, such as data accuracy. The board could access reports anytime, anywhere using digital tools, and they would have the ability to expand or narrow the scope of the report.

We have to spend hundreds of hours yearly creating well-designed, clear PowerPoint presentations for executives. It’s necessary to predict in advance what the key information in the report will be for the audience
Planning in lockstep - align isolated department
Each department and subsidiaries work with their own report. It is time-consuming and risky to collect data from separated sources manually to see the big picture.

Besides the risk of missing database management and the lack of unfilled business intelligence, departments plan in isolation from each other.

The multidimensional model allows employees to work with templates rather than isolated departmental reports. ABUX loads data from any kind of sources (i.e.: ERP, SAP, Oracle, Navision, Excel, txt, etc.) and share data among departments based on pre-built logic and frequency (i.e.: sales forecast between sales representatives and production)

